RE: BTC update 23.01.18 - pointing out the worst case
Thanks again for the tradingview link @ew-and-patterns. In case folks are not aware, Elliott Wave Theory is a study of the fractal behavior of price fluctuations amidst at least 5 various degrees of trend.
Okay, so I just couldn’t resist going to the tradingview site to check it out. As any new charting platform appears to a brand-new user, it most certainly felt quite cumbersome in contrast to my TradeStation platform.
Aside from all of that, within an hour or so after signing up, I rendered this long-term Wave-Count for BTC using monthly price bars. Mind you, this is a very quick study, and rather off the cuff – so I hope that you will take it for what it may be worth.
What my quick interpretation reveals using ALL of the available price data provided, are prospects for a large first-wave, perhaps one of “Cycle-Degree” (largest blue “1” wave) to either still be in progress – or having ended already with the recent all-time highs, which I currently have labeled on this chart as a (3) wave (the smallest blue mark-ups).
I am showing this larger FIRST-WAVE up, subdividing into five impulsive primary waves labeled with the large red numerals. With such a view, the primary 3-wave (red) is subdivided into five waves at intermediate degree labeled in the smaller blue markers as intermediate degree waves (1), (2), (3), (4), and (5). As such, the primary wave 3 lasted roughly 2-years, roughly between 2012 and 2014.
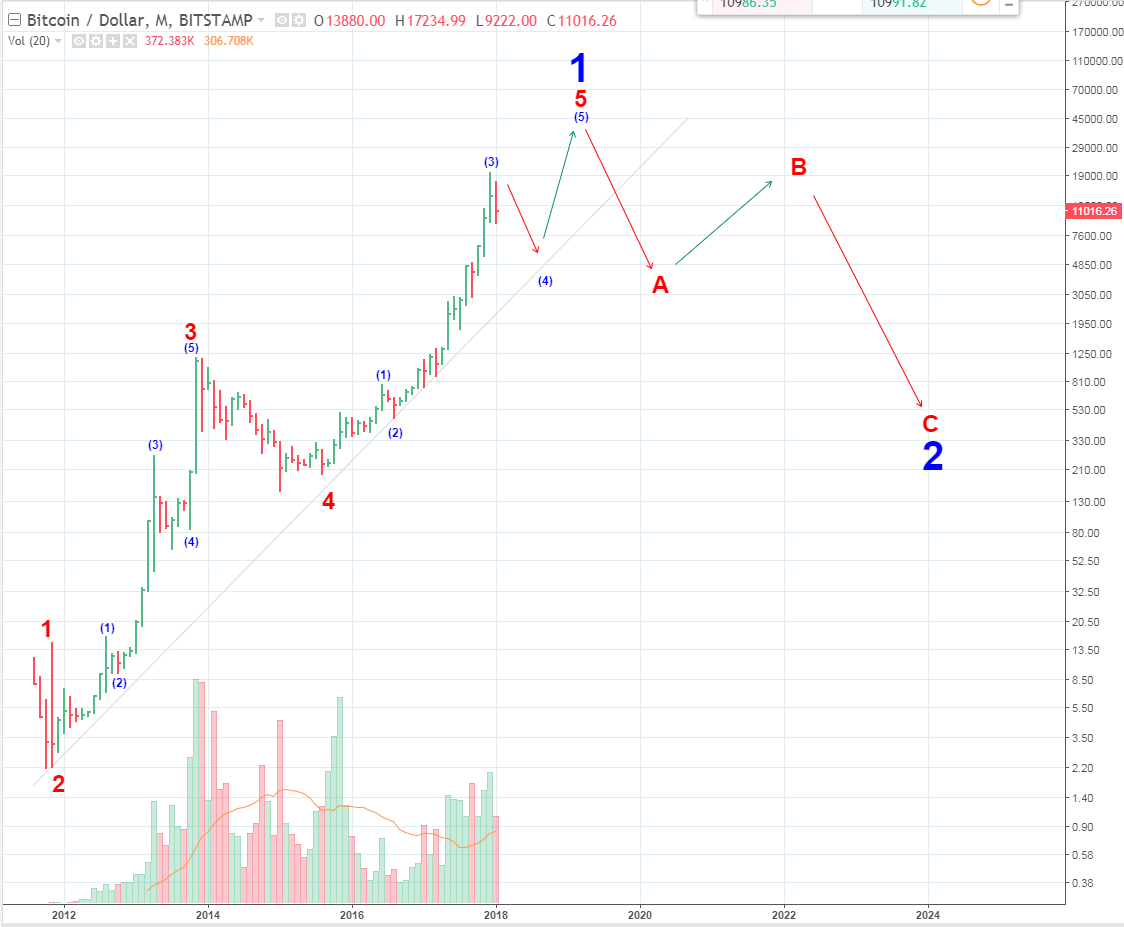
As my count stands here, the primary degree 4th wave decline lasted nearly 2-years as well. It was a sideways affair with a downside bias, as most 4th waves tend to be. This primary 4th wave down ended in the $200 vicinity.
Thereafter, taking us right up to the present, I am showing a powerful extended 5th wave at primary degree (red), subdividing in the five smaller intermediate waves noted.
Insofar as this rather quick study goes, from the recent all-time-high in the 20k vicinity, we may currently be in the midst of an intermediate (4) wave decline (small blue labels), which would then suggest one last push higher is needed to complete the primary degree 5th wave of the yet larger Cycle-Degree 1 wave. Once the current (4) wave decline is complete, this count is EXTREMELY BULLISH over the near-to-intermediate term.
Alternately, and more bearishly, the recent all-time-high may well have marked the end of the large blue first wave up at Cycle Dimension, suggesting that a larger Cycle-Degree wave 2 down may already be underway.
Holding to the tenets that 2nd waves typically decline to the area of the 4th wave at one lesser degree, would suggest that a wave 2 decline at Cycle Dimension, may fall as low as the $200 handle. I’ve outlined such a prospective price path forward into the future using a rough A, B, C, zig-zag decline pattern, which could take many years to unfold – perhaps out as far as 2024.
Well, you asked for it @ew-and-patterns, and there you have it. I do hope that my quick study for a longer term EW look at BTC was up to snuff and that your audience gathered some benefit and insight from it as well. All the best mate, Cheers!
To the top! Just awesome how fast you were able to use all functions of this platform!
I usually don't like logscale because in my experience it distorts the waves and implies equal percentage growth for the future.
This is close to what haejin came up with.
Without logscale it looks like the correction will be done soon, but with it, the chart says that this year BTC will not be able to rise at all. And if this cycle degree wave 1 is already in, it will not rise until 2024 when 200$ was hit? LOL
Or is this a misinterpretation of your chart?
4,356 might be a good target then, but the trendline will likely not be hit again in this correction.
Can you please do an analysis with a linear chart?
Thanks so much again. You should take this entire letter and make a post on your blog out of it.
Thank you, brother! Ha! I too shy away from log scale at all cost (my gold chart below is in arithmetic scale, as I typically prefer.)
The reason I choose log-scale, in this case, is that there is simply not enough historical data to get a good feel for the wave structures. My Gold chart actually goes back to 1975, which provides more than enough historical data to garnish an accurate birds-eye-view in the standard "arithmetic" scale.
I'll pull up a linear chart again to take a second look - but no promises on rendering another interpretation.
Don't know who "@haejin" is, but yeah, I think you've pretty much interpreted my quick count accurately.
I'm a "music-man" now, so I really don't want to paint my blog with technical analysis. Perhaps if I had a second account, I might consider focusing on such - but right now, I am just super busy with the #openmic, and the #openmicsongwriters projects. I truly don't know that I could even find the proper amount of time to give such an endeavor - even if I had a dedicated account handle to do so.
Thanks for the suggestion though, and the link to the charting site - I really appreciate that, brother!
The most important thing is to be posting about what makes you happy. If it's music to you, so be it. But please consider giving my blog a visit from time to time to drop another gem comment like your previous ones.
I am still very interested to see your interpretation of an arithmetic 4 hours/daily chart of BTC :D
Thanks, man! I'm following you... I don't get to my feed as much as I ought to, but when I do, I'll be looking for you. :-)