BITCOIN PRICE TECHNICAL ANALYSIS
Bitcoin price is roaming at the lower side of it's descending triangle and could be due for its downside break
Technical Indicators Signals tells that:
The 100 SMA is below the longer-term 200 SMA so the path of least resistance is to the downside. In other words, a breakdown is more likely to happen than a break to the upside.
Also, the 100 SMA lines up with the triangle resistance so a bounce up to that level could still see its gains limited. The 200 SMA dynamic resistance could serve as the line in the sane for any rallies, although a break past that area could signal that bulls have the upper hand once more.
On the other hand, a move below the $2320 triangle support could be enough to confirm that further losses are in the cards. The triangle pattern spans $2320 to $2970 so the resulting selloff could last by the same height.
Bitcoin Price Key Highlights
Bitcoin price has formed lower highs and found support around $2320, creating a descending triangle pattern visible on its 4-hour chart.
Price is currently testing the triangle support, still deciding whether to make a bounce or a break.
Technical indicators are signaling that further losses are in the cards.
Market Factors
Dollar demand continues to stay supported, Fed chatter really tried on future rate hikes and the balance sheet runoff. In her latest testimony, Fed Chairperson Yellen said that unwinding could impact longer-term interest rates, which then affects dollar price action.
But still, report that Swiss bank Falcon introduced bitcoin in its private asset management service is still being monitored closely.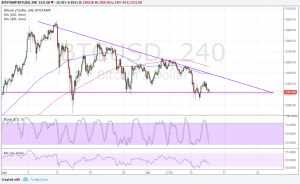
Hi! I am a robot. I just upvoted you! I found similar content that readers might be interested in:
http://www.altcointoday.com/bitcoin-price-technical-analysis-hovering-near-an-exhausted-support-line/