Condensation/Accumulation zone on Bitcoin
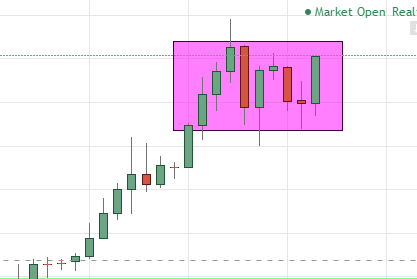
The up-trend shows us a strong demand of bitcoin (weekly chart) followed from the choppy zone in violet.
At the base of the violet square a lot of shadows (the black tails of the candles) test the level and bounce back up;
in particular the last candle that has no closed yet forms a bearish engulfing pattern.
So we could immagine that the base of the square will acts as support and the repeated closes of the last 6 candles as a confirm of that.
What do you think about future scenarios?!
So how long in time does one candlestick represents? I'm learning here so I have only questions and no opinions. Haha
Hi :) The chart above is a weekly one.